How Banks Performed in June Quarter on Key Parameters….
The correction happened despite banks reporting decent results for June quarter. Let’s look at how banks fared in some of its key parameters such as Net Interest Income (NII), Pre Provision Profits (PPP) and Net Profits in June quarter.
We took a sample of top run well managed banks such as HDFC Bank, Kotak Mahindra Bank, ICICI Bank, Axis Bank, IndusInd Bank, RBL and SBI and measured the parameters as stated above.
|
Bank
|
Net interest Income Growth
|
Pre-Provision Profit Growth
|
Profit after Tax Growth
|
|
HDFC Bank
|
22.8%
|
27.0%
|
18%
|
|
Kotak Mahindra Bank
|
22.2%
|
15.9%
|
23%
|
|
Axis Bank
|
13.5%
|
31.5%
|
75%
|
|
IndusInd Bank
|
34.0%
|
38.4%
|
38%
|
|
ICICI Bank
|
25.5%
|
15.5%
|
50888%
|
| RBL Bank |
58.7% |
39.7% |
35.5% |
| SBI |
5.2% |
10.6% |
NA* |
|
* Profit of Rs 2312 crore vs loss of 4875 crore in preceding year
|
| Source: BSE Filling |
We can conclude that results were decent. Then, what was the cause for the correction?
a.FII Holding in Banks is one of the Highest
|
Company Name
|
Foreign Holding as a % of Overall Shareholding
|
|
IndusInd Bank Ltd.
|
51.82
|
|
Axis Bank Ltd.
|
48.34
|
|
ICICI Bank Ltd.
|
43.23
|
|
Kotak Mahindra Bank Ltd.
|
40.65
|
|
HDFC Bank Ltd.
|
38.77
|
|
RBL Bank Ltd.
|
19.02
|
|
State Bank Of India
|
10.92
|
| Source: ACE Equity |
Budget 2019 increased surcharge on super-rich. For an FPI reporting over Rs 5 crore income, effective tax rate goes up from 35.8% to 42.7%. If the same entity is earning between 2 and 5 crore, effective tax goes up from 35.8% to 39%. A tax rate of 42.7% is on a higher side as compared to other nations. This led to a lot of selling by FIIs.
b. Anticipation of Loans Turning Bad on account of Slowdown in Economy
A slowdown is evident in some sectors especially automobiles. Hence, there is a fear on the street of banks reporting higher bad loans popularly termed as non-performing asset (NPA) going ahead.
However, this depends on a case to case basis. We are of the opinion that the clean-up exercise is largely over in the well-run private sector banks. And these banks have good credit policies and risk management practices which will enable them to outshine the public sector banks.
What's Negative for NBFCs, its Positive for Well Run Banks
Additionally, post liquidity crisis cost of capital for non-banking finance companies have risen. Cost of capital in simple terms is the rate of interest at which NBFCs borrow money. People have become skeptical to lend to NBFCs and those who are lending are demanding a higher rate of interest. Further, NBFCs are dispersing lesser loans as their efforts are completely tied up currently to manage their asset liability mismatch.
Well run private sector banks having strong low cost CASA franchise are the biggest beneficiaries of the slowdown in NBFCs.
Capacity Utilization Levels Inching at levels Triggering New Capex Cycle
Further, capacity utilization level of Indian manufacturing unit reached levels of 76% in December 2018. As capacity utilization reaches 80%+ levels, there will be a need to increase capacities which will drive the new investment cycle. As investment cycle picks up, the need for corporate credit will arise, in-turn boosting the loan growth for these banks.
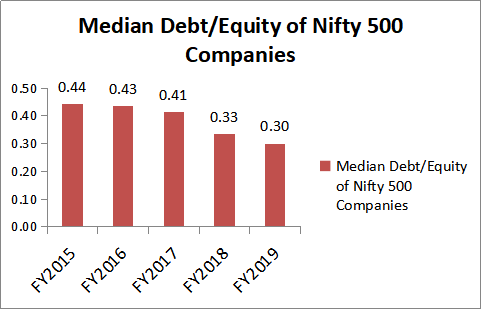
Not only this, the appetite to take leverage on the balance sheet has improved significantly for Indian listed companies. This is evident from the reducing total debt/equity ratio and increasing interest coverage ratio from 2015 to 2019 as seen in the chart below.

Source: ACE Equity
Source: ACE Equity
As Indian companies have reduced its total debt/equity ratio significantly since 2015, it now has the balance sheet strength to take on more debt in order to set up new factories or expand its current manufacturing units.
Convinced on the Banking Story…Which Banks to Buy?
We always recommend our clients to not put all eggs in one basket. Diversification always helps in managing risk. We at WiseBasket have created a stock portfolio of the best banks in India. We have considered key parameters of banks such as return on asset, non-performing asset, net interest income growth, Current Account Savings Account (CASA) ratio, advance growth while selecting these banks and allocating a proper weightage to them. Click here to view or buy our bank basket.
Happy Investing!
The Report includes analysis and views of our research team. The Report is purely for information purposes and does not construe to be investment recommendation/advice or an offer or solicitation of an offer to buy/sell any securities. The opinions expressed in the Report are our current opinions as of the date of the Report and may be subject to change from time to time without notice. Prudent Broking or any persons connected with it do not accept any liability arising from the use of this document. Investors should not solely rely on the information contained in this Report and must make investment decisions based on their own investment objectives, judgment, risk profile and financial position. The recipients of this Report may take professional advice before acting on this information.